The GEQ index is divided into four quadrants. Each quadrant comprises of certain selected indicators, which are scored, aggregated and ranked. This section presents the methodology and provides information about each indicator included in the index. It also lays down any assumptions taken for missing data points and methodology used to fill the necessary gaps.

Scoring methodology
Scoring is calculated by using “min – max” formula


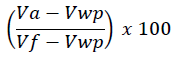
Where “V” is the raw value, “a” is country for which the score is being calculated, “wp” is the value of the worst performer and “f” is the value of the best performing country.
This will result in a standardised score for each country ranging from 0 to 100, 100 being the ideal state. For some indicators, where there is already a calculated index or score computed by a reputed organisation, the index or the score is taken as is. If the score is not based on a standardised scoring of 0 to 100 then the above formula is applied to derive the same.

Indicator Weightage and definition

It demonstrates understanding of a country’s internal key economic factors which impact its internal growth and sustainability. These cannot be changed in the short-term.
Population change is the aggregation of two basic indicator, growth and density, with equal weights. Both these indicators combined together indicates the true population situation of any country. For example, countries where population density is already very high together with high population growth, is of great concern. They cannot be controlled in the short term and create more stress on the natural resources of the country. This information is available to all countries and thus they are already aware of this fact.
    Population growth ... 50%
      Population growth is the annual population growth based on the de facto definition of population which counts all resident regardless of legal status or citizenship. Scoring is calculated by min – max formula; Countries who has growth rate between (0.5) and +0.5 percent are given highest possible score of 100. Outside this range, scores decrease linearly as the distance between the optimal value and the actual value increases. Source: (The World Bank, 2019c)
    Population density ... 50%
      Population density midyear population divided by land area in square kilometres (population based on national censuses estimates). Scoring is calculated by min – max formula; Upper limit value has been fixed to 250. Any country with more than this threshold is given a zero score. Countries with lower population density are given higher scores. Source: (The World Bank, 2019c).
Working demography is the aggregation of two indicator, aging population growth (65 and above) and working population (between 15 and 65), with equal weights. These two important age groups define the future base of the country’s economic and social growth. Countries where the aging population is high and working population is low may become dependent on immigration policy in near future.
    Aging Population growth ... 50%
      Aging Population growth is the annual population growth based on the de facto definition of population which counts all resident regardless of legal status or citizenship. Scoring is calculated by min – max formula; Best score is given to the countries where the aging population growth lower. Source: (The World Bank, 2019c).
    Working population ... 50%
      Working population is the population between the ages 15 to 64 as a percentage of the total population. It reflects the dependency per person of a country. Scoring is calculated by min – max formula; Best score is given to the countries where the working population is higher. Source: (The World Bank, 2019c).
Agricultural land refers to the share of land area that is arable, under permanent crops, and under permanent pastures. Agricultural land covers more than one-third of the world's land area, with arable land representing less than one-third of agricultural land (about 10 percent of the world's land area). It helps understanding the structure of a country's agricultural sector; making economic plans and policies for food security; deriving environmental indicators, including those related to investment in agriculture and data on gross crop area and net crop area which are useful for policy formulation and monitoring. Scoring is calculated by min – max formula; Higher scores are given to the countries with higher agricultural land proportion. Source: (The World Bank, 2019c).
Income distribution data and the Gini coefficient measure inequality in income or consumption. In this area only one indicator was taken from the income distribution sub-group i.e. income share held by lowest 20%. I feel this is most appropriate to show how good the income distribution of a country among its people. The high share will indicate better distribution and equality among the population. Scoring is calculated by min – max formula; higher scores are given to the countries where the income share among lowest 20% is high. Source: (The World Bank, 2019c)
Corruption perception is taken from corruption perception index which aggregates data from a number of different sources that provide perception by business people and country experts of the level of corruption in the public sector. It reveals that the continued failure of most countries to significantly control corruption is contributing the economic distress and development gaps. The index is scored based on standardise data sources to a scale of 0-100 where a 0 equals the highest level of perceived corruption and 100 equals the lowest level of perceived corruption. Source: (Transparency International, 2018).
It indicates how well a country’s internal economy is doing. This directly or indirectly reflects the government’s long-term and short-term policies.
Inflation as measured by consumer price index reflects the annual percentage change in the cost to the average consumer of acquiring a basket of goods and services that may be fixed or changed at specified intervals, such as yearly. It is a crucial index based on which government tries to make effective and appropriate economic policies. Inflation is normalized in a U-shaped function to capture the detrimental effects of high inflation and deflation. Scoring is calculated by min – max formula; Countries with inflation rates between 0.5% and 3% are given the highest possible score of 100. Outside this range, scores decrease linearly as the distance between the optimal value and the actual value increases. Source: (The World Bank, 2019c).
Unemployment rate refers to the share of the labour force that is without work but available for and seeking employment. Unemployment is a key measure to monitor whether a country is on track to achieve the Sustainable Development Goal of promoting sustained, inclusive and sustainable economic growth, full and productive employment and decent work for all. Scoring is calculated by min – max formula; Countries with the lowest unemployment rates are given higher scores. Source: (The World Bank, 2019c).
GDP per capita, (current international $) is the sum of gross value added by all resident producers in the economy plus any product taxes and minus any subsidies not included in the value of the products divided by the midyear population. It is an important indicator of economic performance and a useful unit to make cross-country comparisons of average living standards and economic wellbeing. Scoring is calculated by min – max formula; Countries with the highest GDP per capita are given higher scores. Source: (The World Bank, 2019c).
Ease of doing business with is an established index. It scores for regulatory quality is the aggregate score for getting credit and protecting minority investors as well as the regulatory quality indexes from the indicator sets for dealing with construction permits, getting electricity, registering property, enforcing contracts and resolving insolvency. It measures the degree of economic freedom between commercial and regulatory environment. Countries which are more flexible in doing business benefits from a higher level of entrepreneurial activity. This in turn generates better employment, greater government revenue and higher incomes. The scoring generated by the index is normalised by using min – max formula, 100 being the ideal state. Source : (The World Bank, 2019a).
Government expenditure on education (current, capital and transfers) is expressed as a percentage of GDP. It includes expenditure funded by transfers from international sources to government. It is useful to compare education expenditure between countries and/or over time in relation to the size of their economy; A high percentage to GDP suggests a high priority for education and a capacity of raising revenues for public spending. Scoring is calculated by min – max formula; Countries with the highest proportional spend on education are given higher scores. Source: (The World Bank, 2019c).
Progress of a country does not only depend upon its economic growth but also how culturally and socially it is connected within. Recent rapid growth has created an unsustainable bubble that has built social and economic inequality in society. A socially aware country achieves comparatively better sustainable growth. Economic growth means a rising standard of living for the clear majority of citizens. The value of a rising standard of living lies not just in the concrete improvements it brings to how individuals live but in how it shapes the social, political, and, ultimately, the moral character of a people (Friedman, 2006). Press freedom is also included as one of the indicators on social awareness as the power of media can transform the entire society, specifically in developing countries. The most important use of media is to educate people about their fundamental human rights. Another aspect of this quadrant is showing how its people and the government are aware of the current environmental change and how well they are managing it.
Morality rate, under 5 is the probability per 1,000 that a new-born baby will die before reaching age of five, if subject to age-specific morality rates of the specified year. It is an important indicator of health status and socioeconomic development of a country. Scoring is calculated by min – max formula; Countries with the higher mortality rate are given higher scores. Source: (The World Bank, 2019b).
World giving index is based on survey of 1.3million individuals interviewed across globe over last 10 years covering, helping strangers, donation to charity and volunteered time. This indicates how people of the countries are engaged in prosocial activities and to champion the growth of global living. The scoring generated by the index is normalised by using min – max formula, 100 being the ideal state. Source:(Charities Aid Foundation, 2019).
Press freedom index is adopted which measures pluralism, media independence, media environment and self-censorship, legislative framework, transparency, and the quality of the infrastructure that supports the production of news and information and acts of violence against journalists. Freedom of information is fundamental of any democracy, and without it, there will be no awareness of social deprivations that exists in the society like corruption, tax evasions, human rights, women rights, environmental issues etc. A well-informed society makes better decision and prosperous future. The scoring generated by the index is in reverse order i.e. 0 being the best and 100 being the worst. This scoring is then normalised by using min – max formula and converted to 100 being the ideal state. Source:(Reporters Without Borders, 2019).
Pollutant emission is a very important indicator of country’s environmental awareness and how they are managing it. Two indicators are taken to measure this viz., carbon emission per capita and PM2.5 air pollution (micrograms per cubic meter).
    Carbon emission per capita ... 50%
      Carbon dioxide emissions are those stemming from the burning of fossil fuels and the manufacture of cement. They include carbon dioxide produced during consumption of solid, liquid and gas fuels and gas flaring. Carbon dioxide makes up the largest share of the greenhouse gases contributing to the global warming and climate change. Scoring is calculated by min – max formula; Countries with the lower CO2 emission per capita are given higher scores. Source: (The World Bank, 2019b).
    PM2.5 air pollution ... 50%
      PM2.5 air pollution, mean annual exposure (micrograms per cubic meter) is defined as the average level of exposure of a nation's population to concentrations of suspended particles measuring less than 2.5 microns in aerodynamic diameter, which are capable of penetrating deep into the respiratory tract and causing severe health damage. Exposure is calculated by weighting mean annual concentrations of PM2.5 by population in both urban and rural areas. Air pollution affect the health of the world’s people. It also carries huge economic costs and represents a drag on development, particularly for low- and middle-income countries and vulnerable segments of the population such as children and the elderly. Scoring is calculated by min – max formula; Countries with the lower PN2.5 air pollution per cubic meter are given higher scores. Source: (The World Bank, 2019b).
Renewable electricity output is the share of electricity generated by renewable power plants in total electricity generated by all types of plants. Electricity production is number one source of greenhouse gases, more than all of our driving and flying combined, and clean energy also reduces harmful smog, toxic build-ups in our air and water, and the impacts caused by coal mining and gas extraction. Scoring is calculated by min – max formula; Countries with the higher mortality rate are given higher scores. Source: (The World Bank, 2019b).
This quadrant evaluates the inter-relationship aspects of a countries in terms of investments, assistance, international movement and passport flexibility and tariff rates. Globalisation benefits individual economies around the world by making markets more efficient, increasing competition, limiting military conflicts and spreading wealth more equally (Kuepper, 2019).
The cross-border investments help developing economies to progress and expand at much higher growth rate and at the same time it provides better returns to the investors. Foreign direct investment (FDI) are the net inflows of investment to acquire a lasting management interest (10 percent or more of voting stock) in an enterprise operating in an economy other than that of the investor. It is the sum of equity capital, reinvestment of earnings, other long-term capital, and short-term capital as shown in the balance of payments. In this indicator it measures both FDI inflow and FDI outflow with equal weights. This is because in most developed countries there are more FDI outflows and in developing countries there are more FDI inflows. The purpose of this measure is to evaluate how cross border investment activities are being taken place.
    FDI Outflows ... 50%
      FDI Outflow can increase the investment competitiveness crucial for long-term sustainable growth. It is used by some countries as a catchup strategy to acquire knowledge and technology, upgrade production processes, boost competitiveness, augment management skills and access distribution networks (Stephenson and Perea, 2018). To determine the relative size of the investment, it is looked as a proportion of the country’s GDP. Scoring is calculated by min – max formula; Countries with the higher proportion of FDI outflow as a % of their GDP are given higher scores. Source: (The World Bank, 2019b).
    FDI Inflows ... 50%
      FDI Inflows helps countries to boost their economic growth, human capital enhancement, employment and access to the knowledge and technology. To determine the relative size of the investment, it is looked as a proportion of the country’s GDP. Scoring is calculated by min – max formula; Countries with the higher proportion of FDI outflow as a % of their GDP are given higher scores. Source: (The World Bank, 2019b).
Development assistance by country comprises of grants or loans to developing countries and territories on the OECD/DAC list of aid recipients that are undertaken by the official sector with promotion of economic development and welfare as the main objective and at concessional financial terms. This displays how the developed countries promote economic development and welfare in the developing countries. Scoring is calculated by min – max formula; Countries with the higher proportion of development assistance as a % of their GNI are given higher scores. Source:(OECD, 2019a).
Passport freedom refers to the number of destinations their holders can access without a prior visa. Freedom of movement is a crucial commodity in a globalized economy. It helps individuals to travel to different countries, understand their culture, gain knowledge and their spend boosts the host country’s economy. Scoring is calculated by min – max formula; Countries whose passport that allows higher number of visa free access are given higher scores. Source:(Henley & Partners, 2019).
International Tourism expenditure are expenditures of international outbound visitors in other countries, including payments to foreign carriers for international transport. Tourism a key driver of socio-economic progress through export revenues, the creation of jobs and enterprises, and infrastructure development. As an internationally traded service, inbound tourism has become one of the world's major trade categories. In this indicator, international tourism expenditure as a % of total import of the country is assessed. Scoring is calculated by min – max formula; Countries with the higher proportion of international expenditure as a % of their total import are given higher scores. Source: (The World Bank, 2019b).
Tariff rate, weighted mean of all products (%) is the average of effectively applied rates weighted by the product import shares corresponding to each partner countries. Tariff has uneven benefits. It is revenue to the governments and increases competition in favour of domestic companies but for consumers it means higher prices for imported goods. For this index we will consider lower tariff helps economy in terms of better competition and lower the price. Scoring is calculated by min – max formula; Countries with the lower average tariff percentage are given higher scores. Source: (The World Bank, 2019b).
International migrant stock is the number of people born in a country other than that in which they live. It also includes refugees. The data used to estimate the international migrant stock at a particular time are obtained mainly from population censuses. The estimates are derived from the data on foreign-born population--people who have residence in one country but were born in another country. When data on the foreign-born population are not available, data on foreign population--that is, people who are citizens of a country other than the country in which they reside--are used as estimates. Movement of people, most often through migration, is a significant part of global integration. Migrants contribute to the economies of both their host country and their country of origin. Global migration patterns have become increasingly complex in modern times, involving not just refugees, but also millions of economic migrants as well. Scoring is calculated by min – max formula; Countries with the higher migration stock as a percentage to total population are given higher scores. Source: (The World Bank, 2019b).